

Fill Rate
Fill Rate measures the percentage of records that have a value for each analyzed field.
The Fill Rate analysis calculates for each field how many records have a non-empty value versus how many are blank. A fill rate of 100% means all analyzed records have a value filled in for that field; 0% means the field is empty on all records.
Use this analysis to identify data completeness issues, to check whether required fields are actually being filled, for evaluating field readiness for reporting and automation, and to decide which fields need enrichment, stricter enforcement, or removal. Because Monitor also groups analysis results by each field's Requirement Level, the Fill Rate analysis is a quick way to see whether your Dataverse-required fields are truly complete, not just marked as required.
Configuration
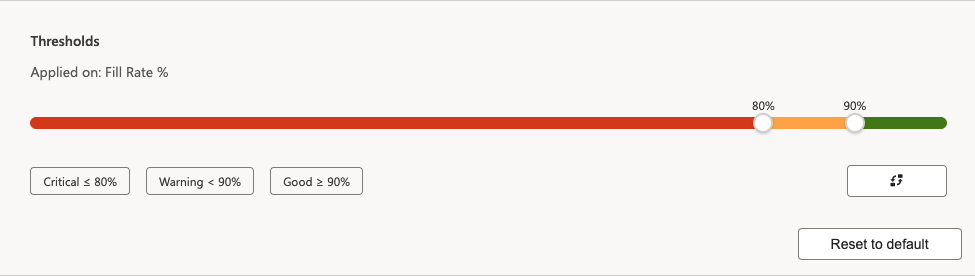
Set a threshold for what constitutes a good, warning level, or critical fill rate. For most fields that you apply a Fill Rate analysis to you'll want to have as much fields filled as possible. This would mean for example a good fill rate is 90% or more, warning level would be between 80-90%, and anything less than 80% filled would be critical.
For those cases where having empty fields is good, you can reverse the threshold signalling by clicking the Reverse button.
Detailed Job Results
On the Monitor Job Results page, the Fill Rate card shows the total number of fields analyzed and the average Fill Rate across them.
The Fill Rate Distribution doughnut chart groups all analyzed fields into 20-point Fill Rate ranges (0-20%, 20-40%, 40-60%, 60-80%, 80-100%); hover over a segment to see how many fields fall into that range.
The bar chart, Average Fill Rate by Requirement Level, shows the average Fill Rate separately for Required, Recommended, and Optional fields, based on each field's Requirement Level in Dataverse.
Load all fields first
The Average Fill Rate bar chart only shows results for those fields that have been loaded in the table view below. When you analyzed a large number of fields, not all fields are loaded initially.
Scroll all the way down and click Load More to load more fields. The Average Fill Rate bar chart will then display the results for all loaded fields.
The table below lists each field's Requirement Level, the Fill Rate percentage (Fill Rate %) color-coded against your configured thresholds, and the number of records without a value for this field.
Key Insights
- Data completeness at a glance: the distribution chart shows immediately whether most of your fields are well-populated or mostly empty.
- Required fields, verified: the Requirement Level breakdown shows whether fields marked Required or Recommended in Dataverse are actually filled on records, not just enforced at the form level.
- Trust level for reporting and AI: fields with a low Fill Rate are unreliable for use in dashboards, KPIs, or AI models; treat the Fill Rate percentage as a practical trust score for each field.
- Cleanup candidates: Optional fields with a very low Fill Rate and low business value are good candidates for retirement, simplifying forms and reducing entity clutter.
- Threshold color-coding drives triage: because thresholds are configurable per field, the color on the Fill Rate % badge tells you at a glance which fields need attention first.
Recommended Actions
| Scenario | Actions |
|---|---|
| Required or Recommended fields with low Fill Rate | - Check whether the field is truly enforced on all entry points (forms, flows, imports, API). - Add business rules or required-field settings so all channels enforce it. - Run a data cleanup or enrichment pass for records where it's empty. - Re-run the Fill Rate analysis to confirm improvement. |
| Optional fields with very low Fill Rate | - Decide whether to keep and promote the field, or retire it to simplify the form. - If keeping it, check whether it should be reclassified as Recommended in Dataverse. |
| Preparing fields for AI or reporting use | - Set a minimum Fill Rate threshold for fields used in analytics, for example 80% or higher. - Only use fields above that threshold in AI models, dashboards, and KPIs. - Review Fill Rate regularly for fields feeding key reports. |