

Number Analysis
Number Analysis calculates key statistics such as minimum, maximum, mean, and standard deviation for numeric fields, and flags values that fall far outside the normal range.
The Number Analysis runs against numeric field types such as Number, Currency, and Percent, and computes a statistical profile for each selected field: minimum, maximum, mean, standard deviation, and an outlier count. A value is counted as an outlier when it falls more than 2 standard deviations from the field's mean. Only records with a non-null value in the field are included in the calculation.
Use this analysis to get a quick health check on a numeric field, for example to catch data entry mistakes, unit mismatches, or placeholder values before they distort reports or automation.
Number Analysis or Standard Deviation Analysis?
Both calculate a mean and standard deviation, but they answer different questions. Number Analysis gives a broader statistical profile per field, including min, max, mean, and standard deviation, and counts individual records more than 2 standard deviations from the mean as outliers. Standard Deviation Analysis focuses on relative variability using the Coefficient of Variation (CV), which lets you compare spread across fields even when their means differ widely. Use Number Analysis to catch individual anomalous records; use Standard Deviation Analysis to assess and compare overall field-level variability.
Configuration
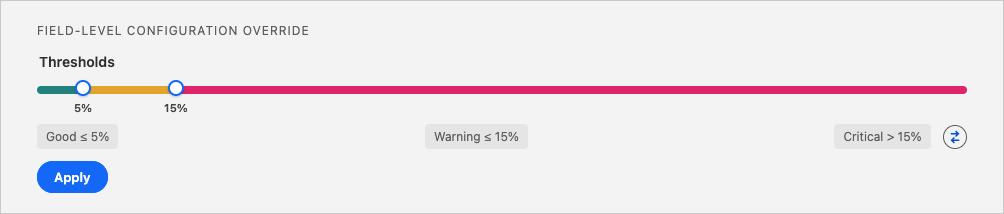
Set a threshold for what constitutes a good, warning level, or critical percentage of outlier values. For most fields that you apply a Number analysis to you'll want to have as few outliers as possible. This would mean for example a good outlier rate is 5% or less, warning level would be between 5-15%, and anything over 15% outlier values would be critical.
Detailed Job Results
A field value is flagged as an outlier compared to the field's other values, when it falls more than 2 standard deviations from the field's mean.
The Outlier Rate per Field bar graph shows the percentage of outlier values for each field. Hover over a bar to view more field value calculations, such as the average and mean.
Below, the Field Statistics table displays per field the number of records with a value for that field ( # Records with Value), and the field value calculations: the average (Average Number Value), lowest value (Min Number Value), highest value (Max Number Value), Standard Deviation, the outlier value count ( # Outliers), and the percentage of outlier values ( % Outliers) labeled with its threshold color.
Key Insights
- Outlier count: A high percentage of flagged outliers suggests inconsistent data entry, integration errors, or placeholder values in that field.
- Typical range: The min, max, and mean together show what a "normal" value looks like for the field, making it easier to spot when something is off.
- Scale mismatches: A mean or max that's off by orders of magnitude (for example, cents recorded instead of dollars) often points to a broken form or integration mapping.
- Placeholder values: Repeated extreme values, such as 999,999 or 1, can indicate users entering placeholder data instead of leaving a field blank.
Recommended Actions
| Scenario | Actions |
|---|---|
| A field shows extreme outliers | - Investigate outlier records for typos, missing or extra zeros, or incorrect units. - Add validation rules or flow checks to block impossible values going forward. - Correct or remove confirmed bad records from existing data. |
| Values are consistently off by a fixed scale | - Check integrations and forms for currency or unit mismatches, such as cents versus dollars. - Normalize the field to store values in a single consistent unit going forward. |
| Protecting reports and dashboards from distortion | - Exclude or cap outlier values in reports that calculate sums, averages, or KPIs. - Create a sanity-check filter for key numeric fields used in forecasting. |
| Preparing data for AI or scoring models | - Flag or remove anomalies before using the field in model training. - Use capped or log-transformed values for scoring, and risk and anomaly detection models. |