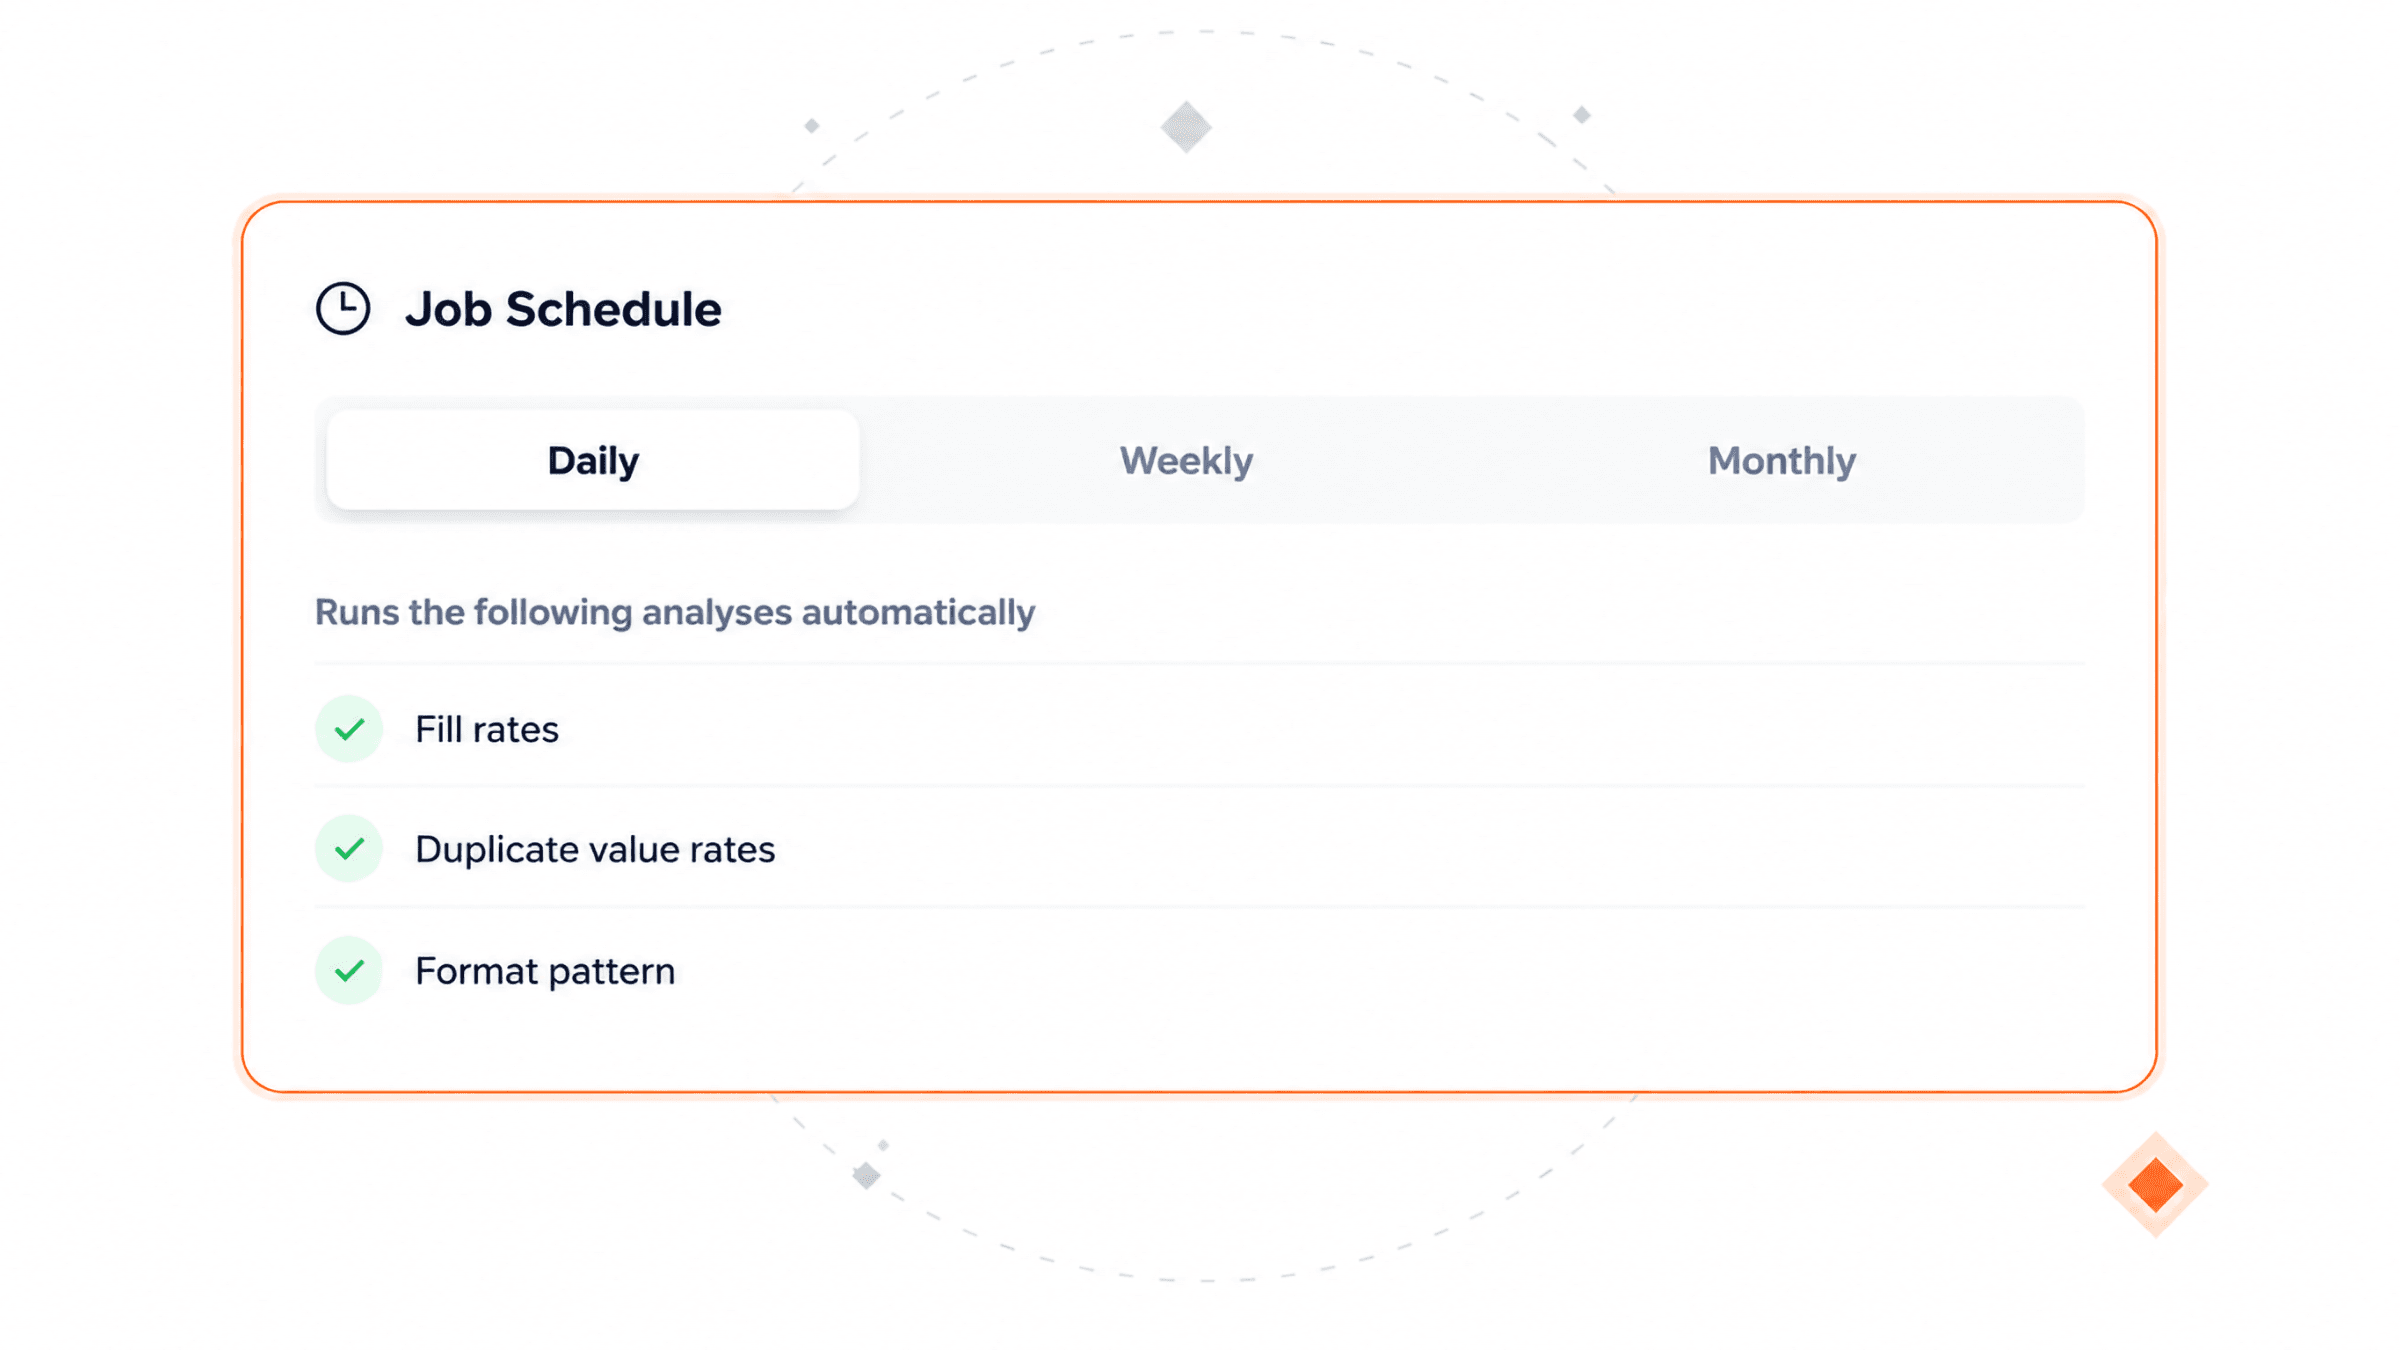
Nobody has to remember to run it
Pick daily, weekly or monthly and it goes on its own: fill rates, duplicate values, format patterns and the rest.
The same analyses run daily, weekly or monthly, and every result is kept. That history gives each field a trend line, so you see the direction and what changed since the last run.
Set the frequency once per object. Every result is kept.
Every run adds a point to that field's graph. You get the latest value next to how much it moved since the last run, over any date range you pick.
Set good, warning and critical levels as percentages. Anything that crosses one is flagged amber or red, and any field can have its own levels.
A PDF per object in plain language: its quality score, the change since the last job, and a card per problem naming the field, the metric and what to do about it.
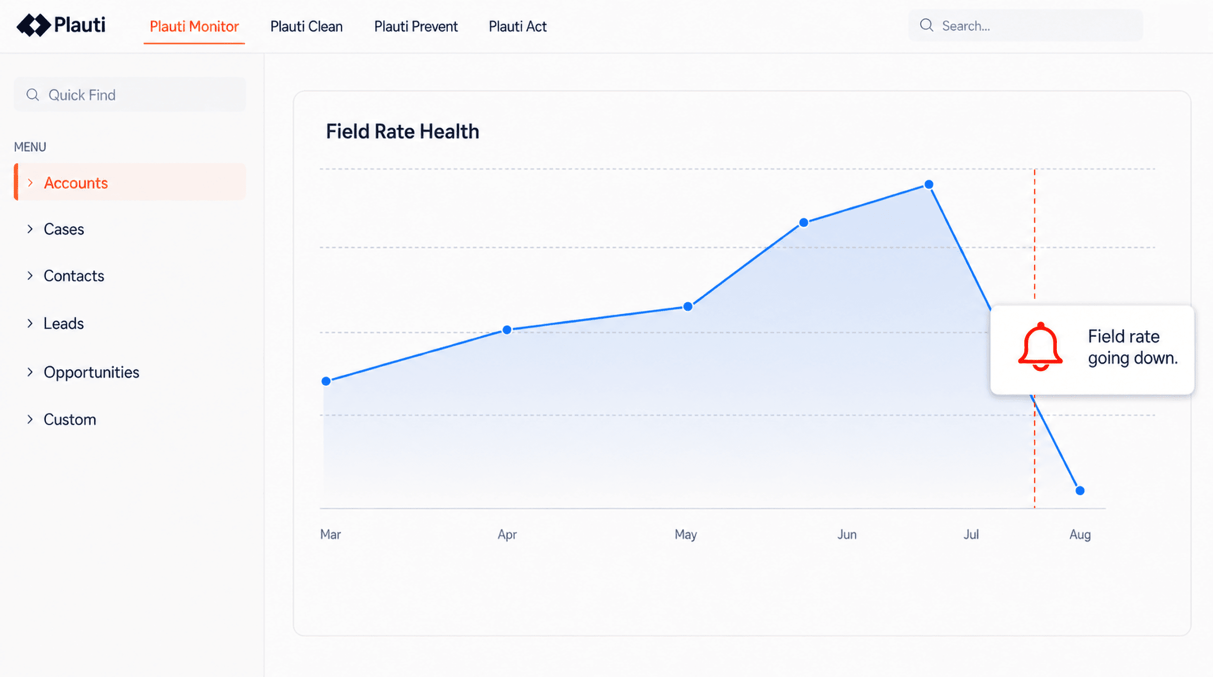
Get alerted when something needs your attention.
Pick daily, weekly or monthly and it goes on its own: fill rates, duplicate values, format patterns and the rest.
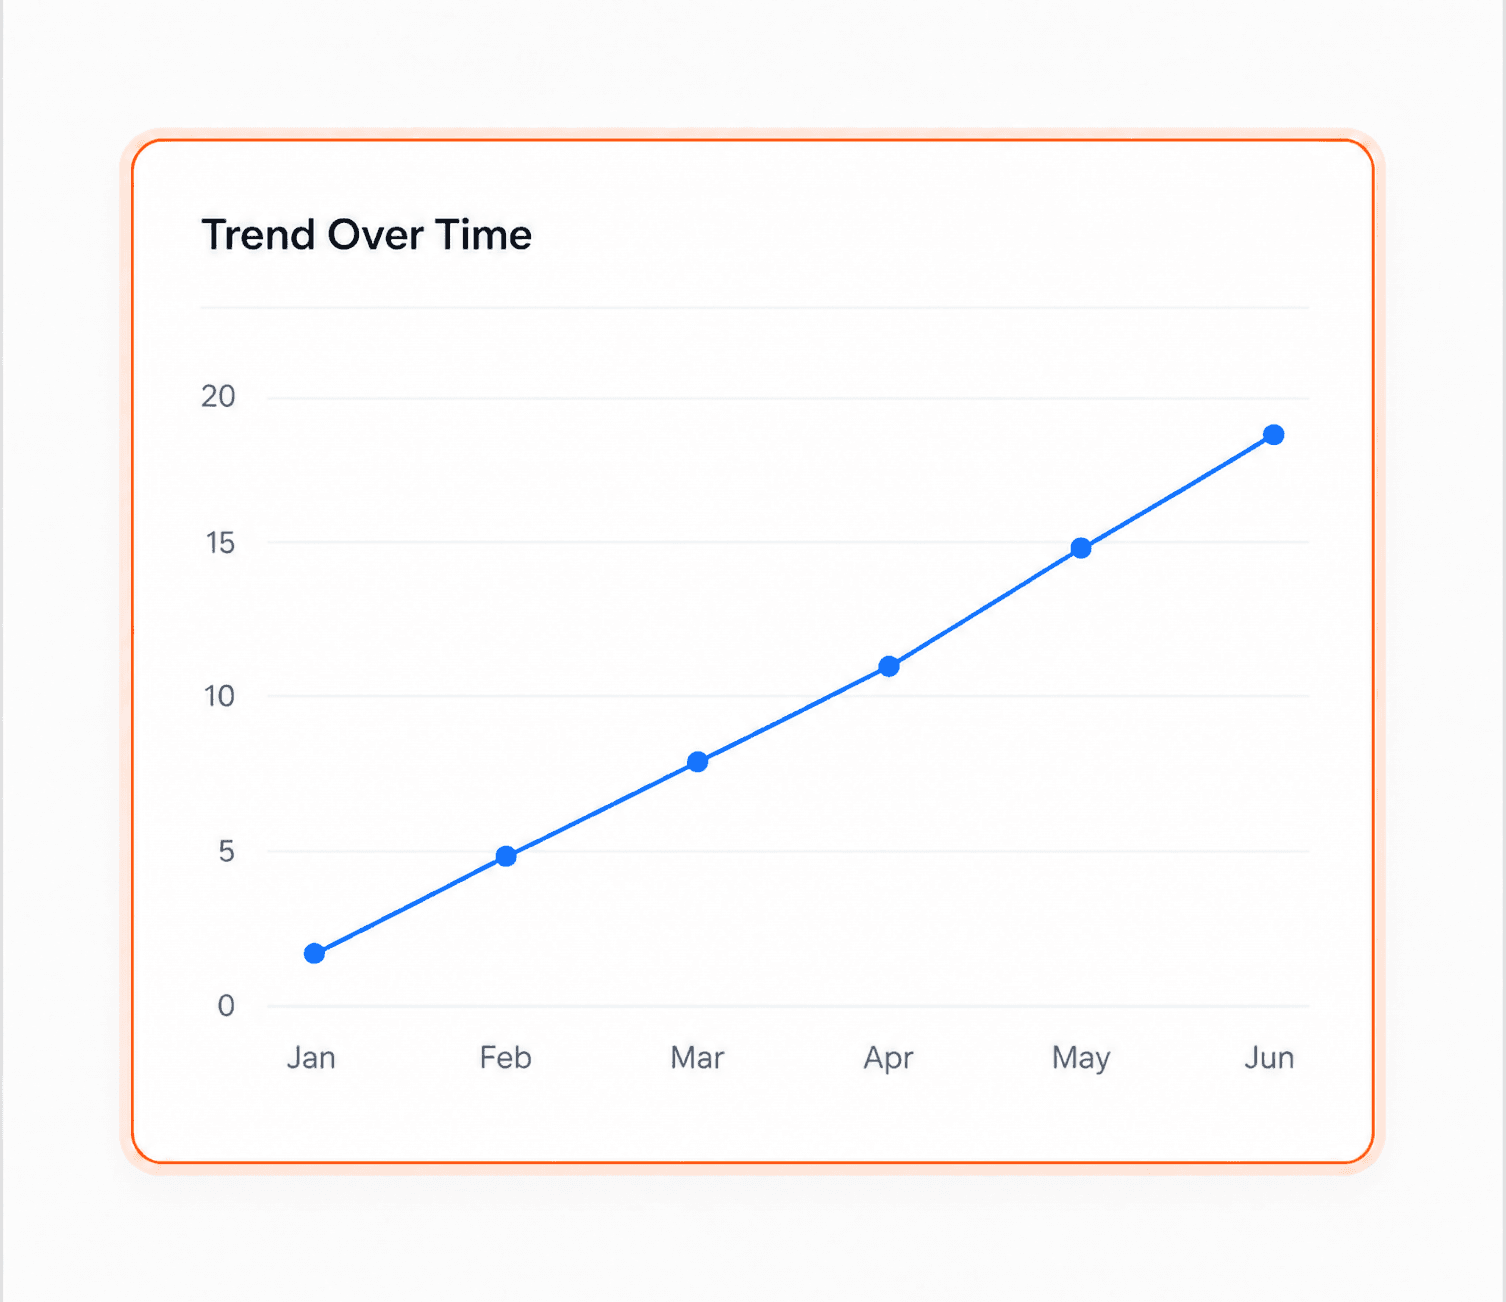
See which way your data quality is moving, not just where it sits today.
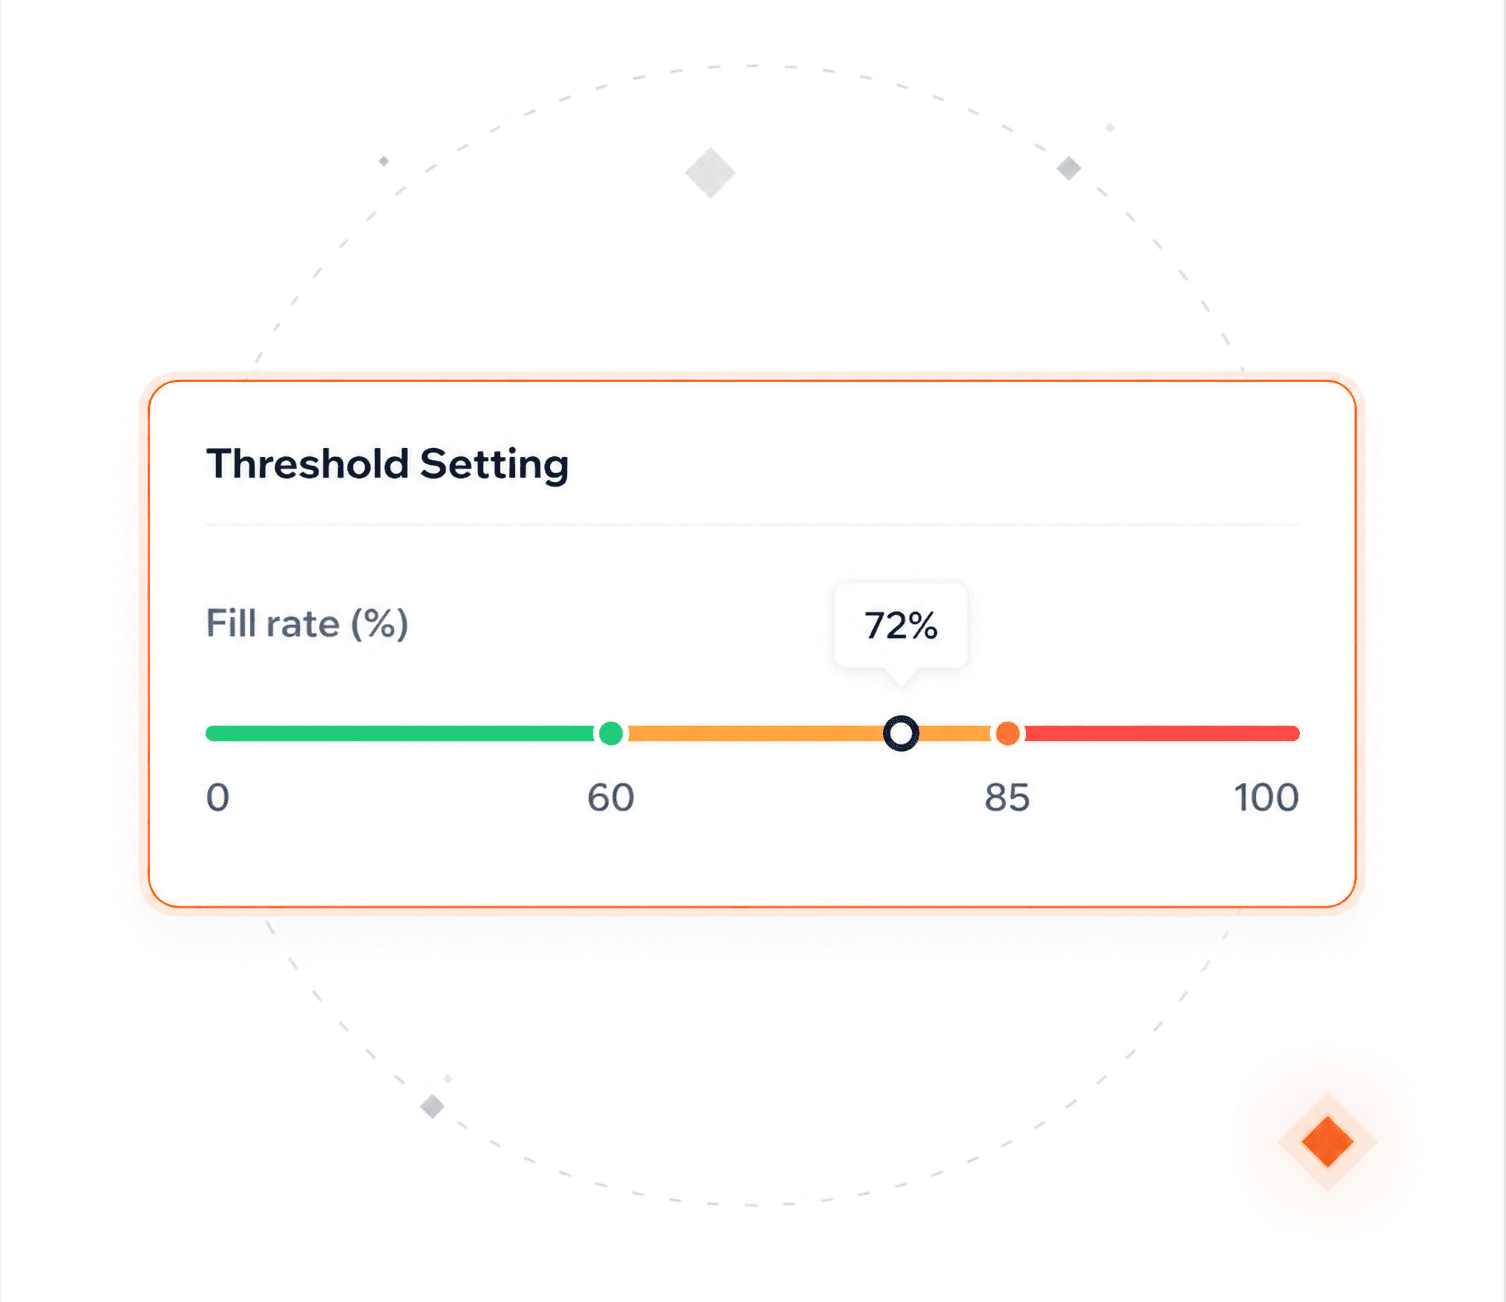
You set the thresholds per field. Anything crossing the line turns amber or red. Alerts when quality drops (coming soon).
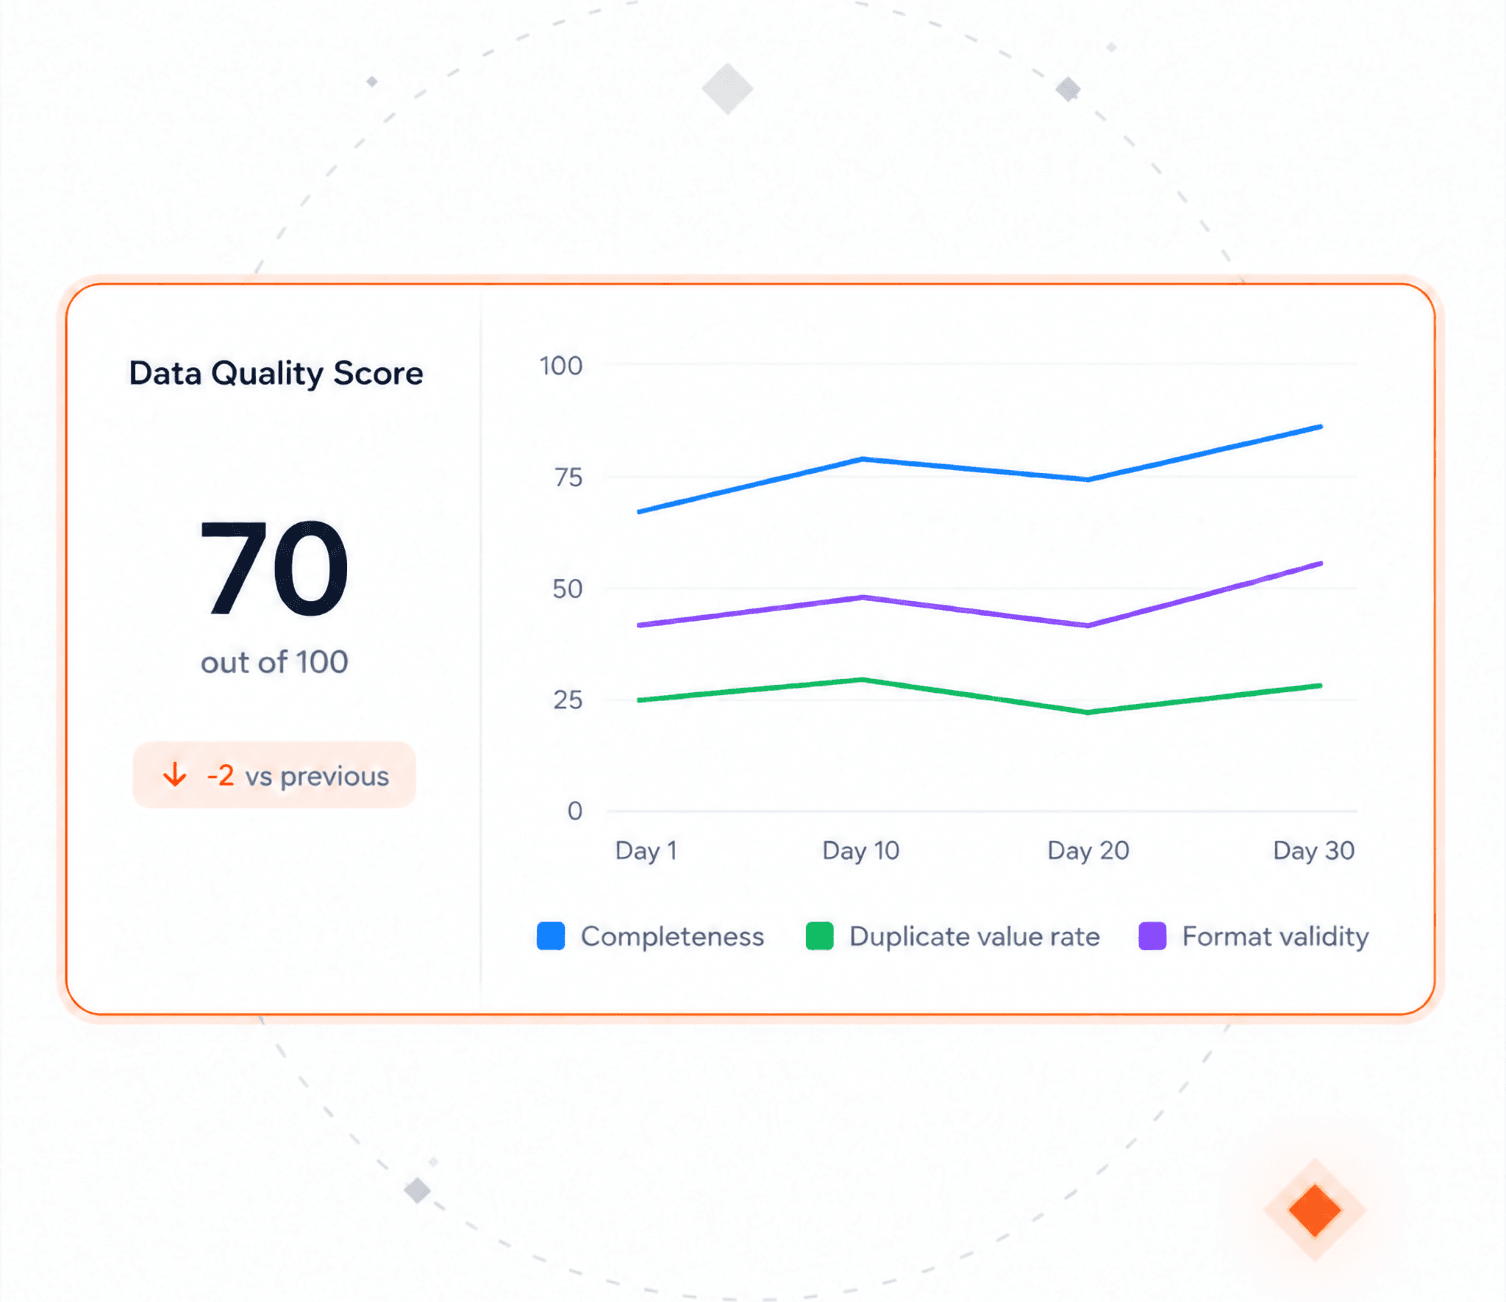
One place to look, so nobody argues about whose numbers are right.
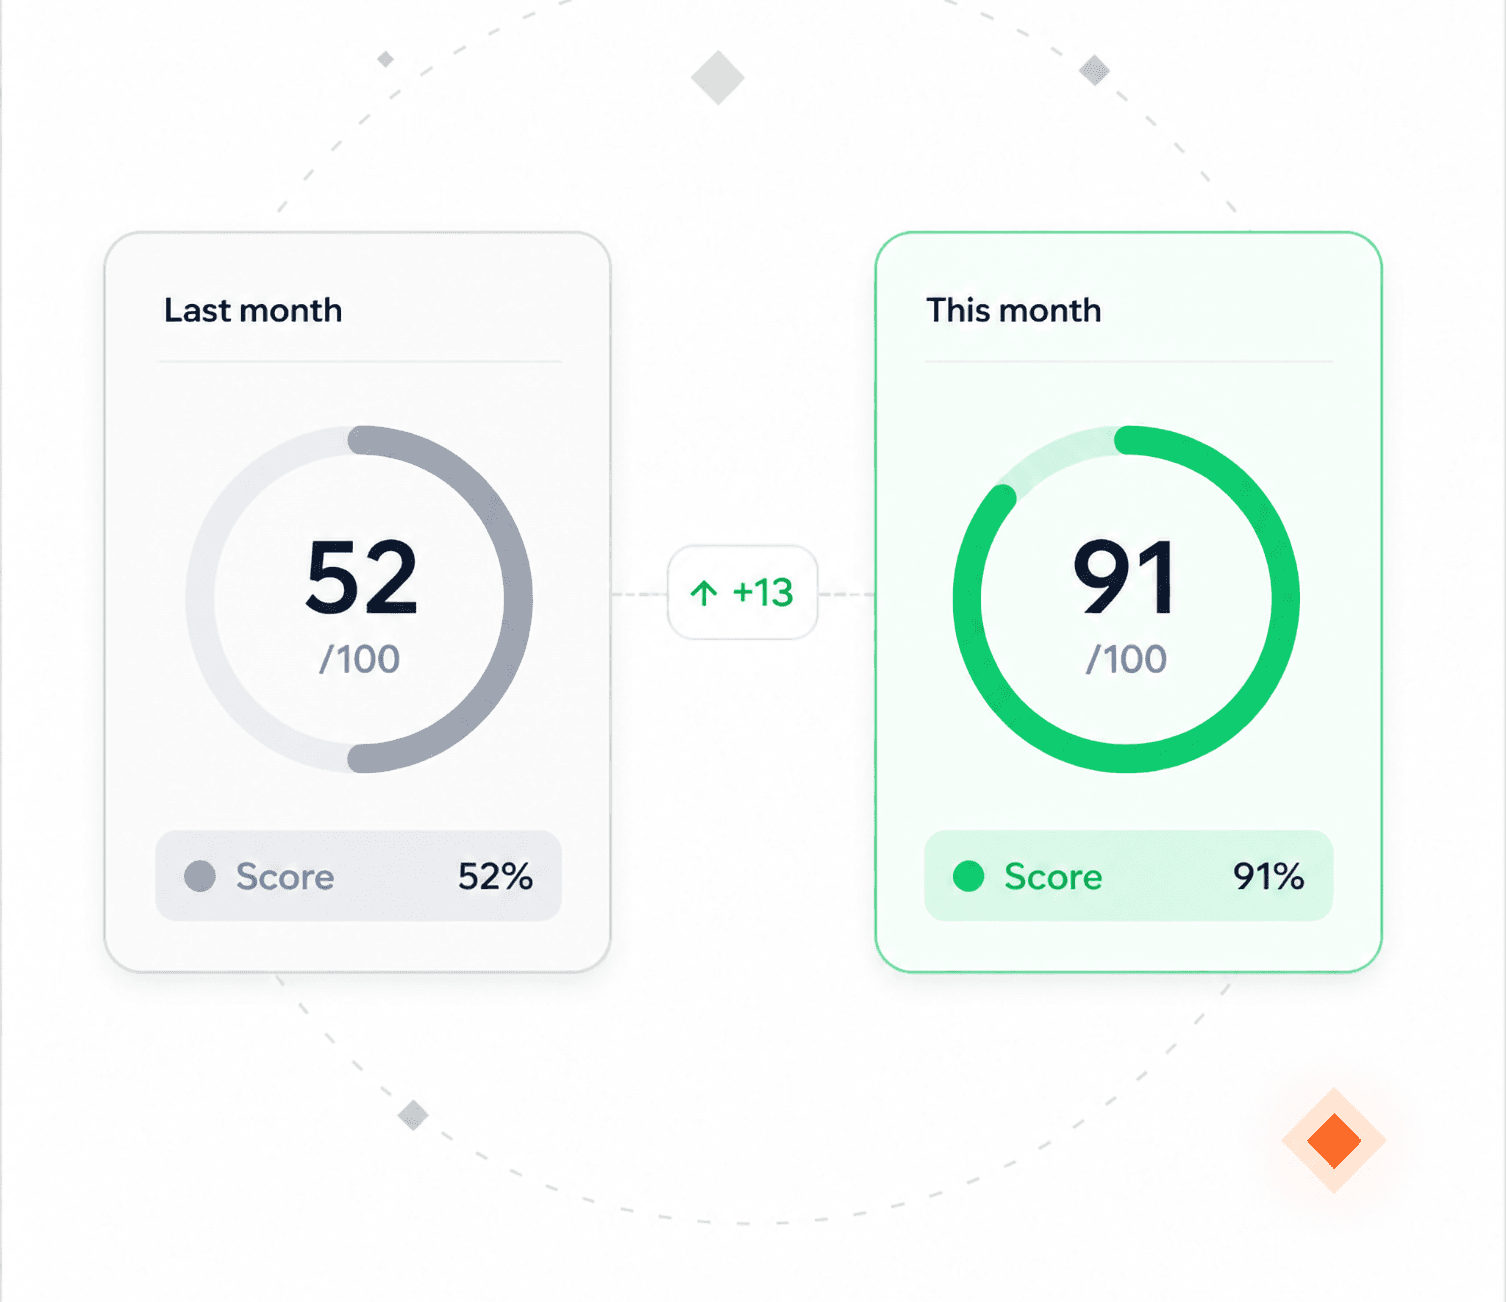
Compare this month with last, and the improvement is something you can show rather than claim.
Daily, weekly or monthly, chosen per object. The objects that change fastest can run the most often.
Keep enough runs to see a trend. Older results clear out on their own, unless you switch that off.
Results live on their own records. Nothing lands on yours unless you ask for it.
Every calculation runs under the permissions and field security you already have.
Interactive product tours. No install, no sales call.
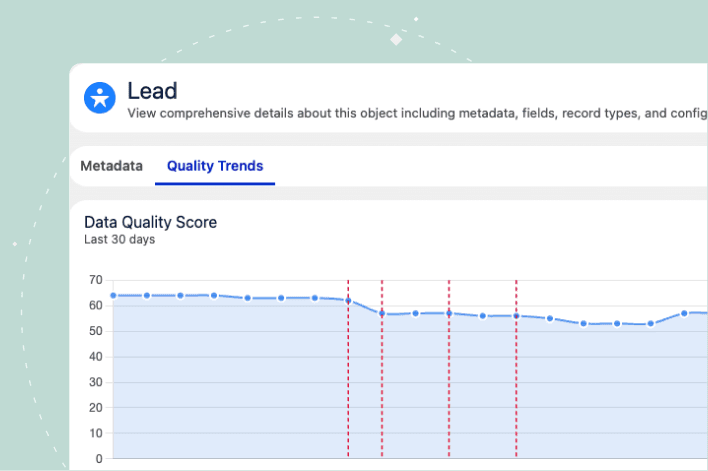
Continuously monitor your CRM data health and get alerts when something needs your attention.
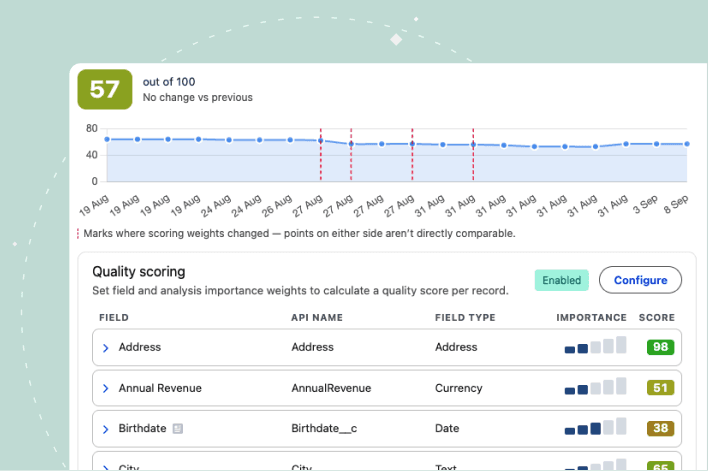
Every object and field, rated out of 100.
AI readiness
"I think my biggest fear with bad data and AI is that it's going to give poor recommendations or results. There's nothing worse than implementing a project, rolling it out, and then it not doing as well as you expected. Then you get mistrust, and you have to work twice as hard to convince people it's fixed."

Alex Casey — Sales Technology Innovator
Wedgewood Weddings

A cleanup is a point in time. With nothing watching, the same fields drift back and the work gets done twice. Monitoring is what tells you whether the fix held, and which fields are sliding back before the next project inherits them.
An assistant answers the question you ask, and you cannot ask what you do not know. It also cannot tell you what a field's fill rate was a month ago unless someone stored that answer somewhere. Monitoring runs the same checks on every field you picked, keeps every result, and holds your own thresholds for what counts as good or bad. And because each result is stored as a record, an assistant can read the answer back instead of scanning the whole org again every time someone asks.
No. A schedule covers every analysis type and field enabled on that object. To keep something out of the recurring run, disable it on the object first. Frequency is per object, so different objects can run at different rates.
After each run, and only then. Saving a record does not change them, so how fresh the numbers are comes down to how often you run it.
Not unless you switch it on. By default the score sits on its own record. If you do switch it on, every scored record is updated on every run, which changes its last-modified date and can set off automations and syncs.
That depends on two things you set: how many objects you monitor, and how long you keep results. Results are stored on their own records, one per scored record, so more objects and a longer retention period mean more of them. Anything past the age you set is cleared automatically, and you can purge by field, analysis type or date range yourself.
It uses API calls. Run it in the quiet hours, keep most objects on weekly, and stagger them across different hours so the load spreads.
Talk with one of our experts to see how that works for your use case.